Opiniones Clientes

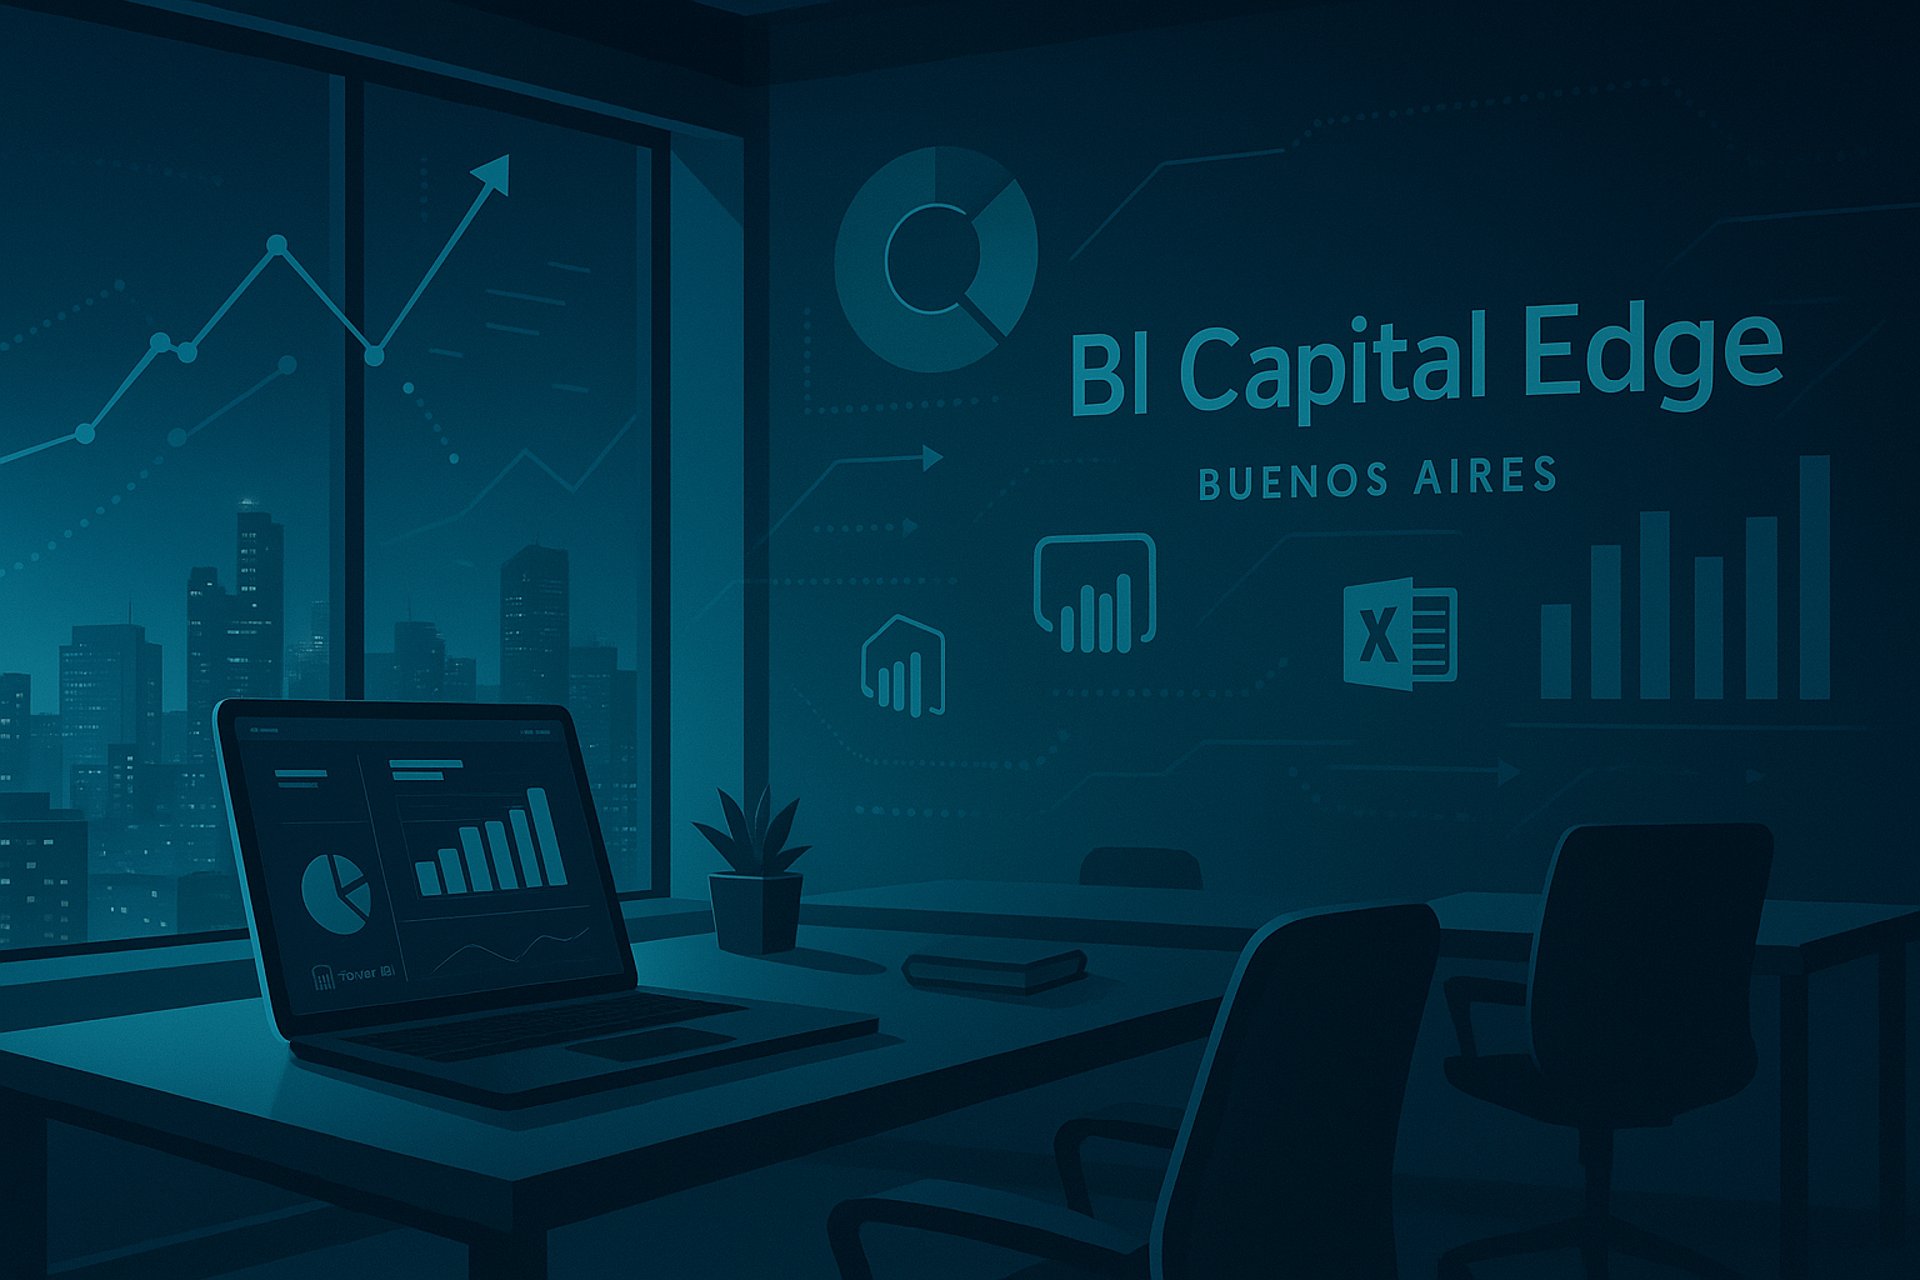
Descubre cómo Bi Capital Edge transforma la gestión de tu negocio.

La claridad que necesitaba. Ahora puedo detectar problemas antes de que surjan.

María López
A car dashboard display showing various metrics including battery level, fuel range, odometer reading, and Bluetooth audio connectivity. The display includes indicators for power usage in kilowatts, EV range in miles, and a speedometer set to zero mph. The dashboard has a sleek, modern design with vibrant colors.

Buenos Aires

Bi Capital Edge ha revolucionado nuestra forma de trabajar, permitiéndonos identificar patrones y mejorar nuestras ventas de manera significativa. ¡Altamente recomendado!

A web browser window displaying the Airtable website with navigation options such as Product, Solutions, Pricing, and more. The main content promotes a message to 'Connect everything. Achieve anything.' Below is a visual representation of a digital workspace with photos, charts, and various task panels. The background features a color gradient from blue to red.
Juan Pérez

Córdoba

★★★★★
★★★★★

Contáctanos para mejorar tu negocio

Estamos aquí para ayudarte a optimizar tu información empresarial.

An abstract, pastel-colored, 3D-rendered representation of data analysis and search engine optimization (SEO). The image features a computer interface with various analytics symbols, including a magnifying glass, bar charts, pie charts, and a search bar with the text 'SEO'. Surrounding the interface are different objects such as a potted plant, a cup with a saucer, and a megaphone, all placed on a light green background.